Chasing business MacGuffins
In the beginning of an adventure or a mystery, you are often introduced to a MacGuffin – sometimes its a glowing treasure chest, or a microchip with shocking documents, or blueprints for a secret weapon. While it is an object that is necessary to the plot and motivation of the characters, it is something that the audience certainly does not care about.
In the business world, we often tend to chase similar MacGuffins or, to use a more popular term, vanity metrics. Let’s take a closer look at one of them – the Net Promoter Score (NPS).
Developed by Frederick Reichheld, (currently a Bain Fellow at Bain & Company), the NPS asks customers a simple question:
“On a scale of 0 (Least Likely) to 10 (Most Likely), how likely is it that you would recommend our company/product/service to a friend or colleague?”

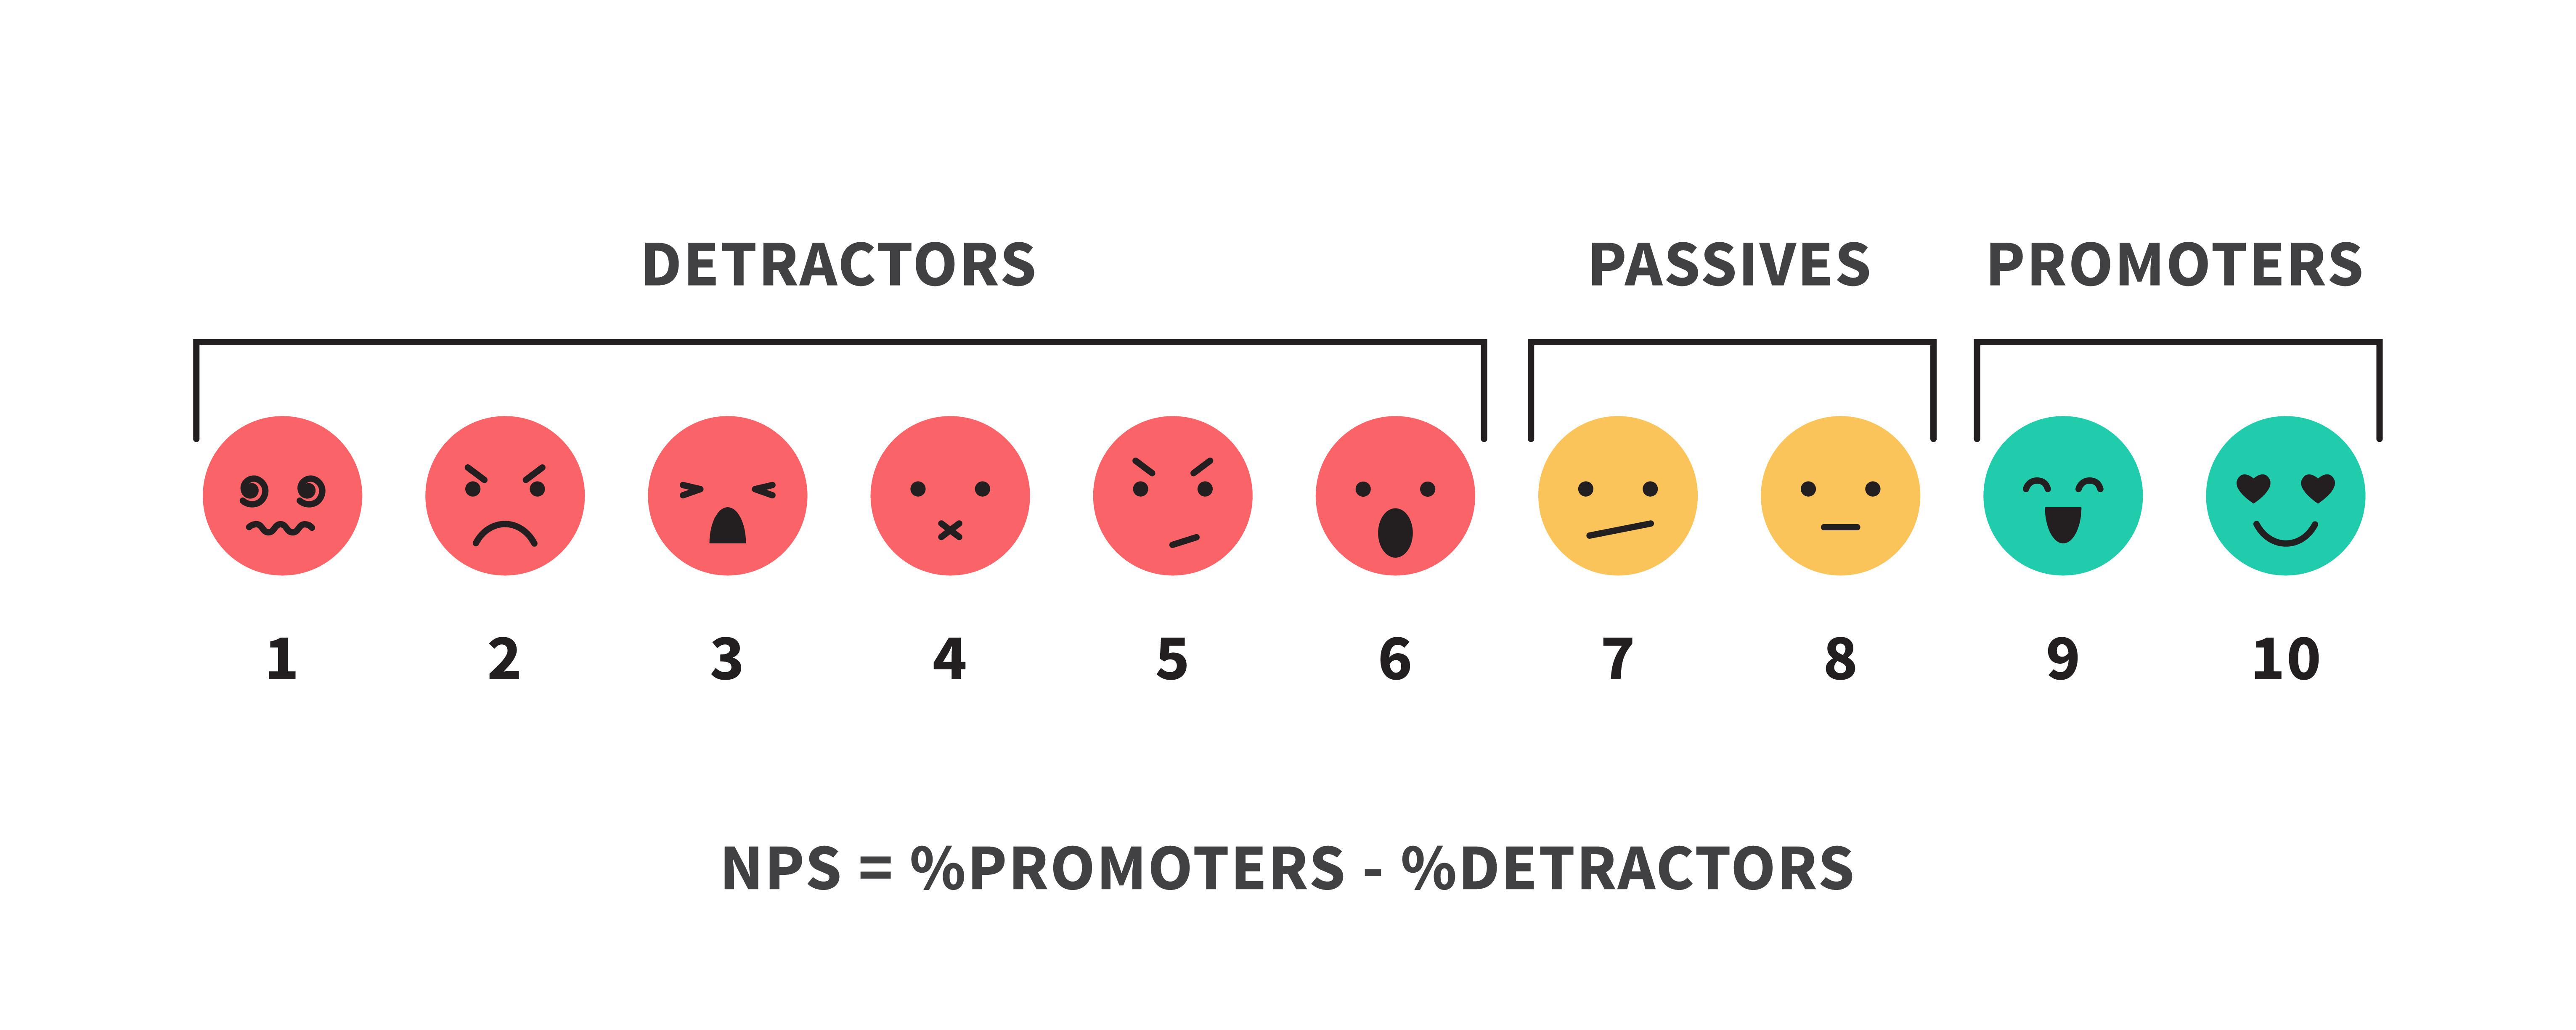
Customers that give you a 6 or below are Detractors, a score of 7 or 8 are called Passives, and a 9 or 10 are Promoters. To calculate your Net Promoter Score, subtract the percentage of Detractors from the percentage of Promoters.
There are some inherent problems with this metric that most organisations tend to ignore. Lets break them down:
a) As a standalone number NPS doesn’t give us any insight, even if it increases or reduces. For example:
- Percentage of detractors = 30%
- Percentage of promoters = 40%
- NPS = 10
If this NPS score increases by 10 and becomes 20, then the following scenarios can emerge:
Scenario A:
- Percentage of detractors = 30%
- Percentage of promoters = 50%
- NPS = 20
Scenario B:
- Percentage of detractors = 10%
- Percentage of promoters = 30%
- NPS = 20
And so on. As a stand alone number, we have no way to tell whether the number of promoters grew or did detractors reduce? There are multiple combinations that can result in this outcome, thus bringing us to our next point
b) It’s critical to understand underlying metrics and causative factors of an NPS score. It makes more sense to track detractors and promoters individually, gathering respective qualitative feedback and understanding trends. You can run text analytics on the feedback to uncover patterns and discover sentiment based insights.
But then how is this different or better from what we do with CSAT or any other customer experience metric? From a basic viewpoint, these are not meaningfully different. They are scales measuring some form of customer sentiment (satisfaction, loyalty, virality etc.). You can use any one of them, a combination or perhaps invent a new metric altogether!
c) NPS tends to assume that detractors can’t be promoters and vice versa. Companies, brands, products and services are multi faceted and humans that interact with them are complex. Academic surveys have proved that even detractors end up recommending a brand. It gets even more complicated when you start to look at it from different lenses.
Using of a crude example: You would recommend Netflix to your friends for the edgy content, great UI etc. but not to your parents due to lack of appropriate content, inability to use etc. The above assumption can mistakenly inform your subsequent marketing communications. We need to double click and understand context rather than rely on broad generalisations
d) Rounding this up with our last point. If you take a bell curve distribution of your customer ratings, then calculating NPS is meaningless statistics. Subtracting a percentage from another percentage within the same distribution provides no insight. If there is a differing opinion then I would love to hear your take on this.
So does this mean we ditch the NPS? Not really. Organisations have found innovative ways of improving on the current form of NPS and how it needs to be consumed. In fact Bain & Company have improvised and spun it off into a separate “system“. Here are some simple tips to help you structure your effort:
- Ensure that the simplicity of your metric doesn’t become a tradeoff for usefulness. Whether its an NPS, CSAT or any other metric, its always more important to focus on the follow up question i.e. the “why” behind that score
- The qualitative follow up questions tend to be a chore for customers to fill up. Try and optimise them to exhaustive bite-sized questionnaires (3 to 4 questions max) with limited multiple options. Easier said than done though
- Take an A/B test approach to gauging customer experience (mix of metrics, UX tweaks etc.) and, if possible, track downstream behaviour for a statistically significant sample size(do they actually recommend, evangelise etc. ?). Maybe you will discover that NPS works better for your org than anything else
- Rarely anything beats our time tested metrics – revenue, profit and cost. If any of these can be attributed to specific customer feedback, interaction etc. then you are good to go. At the end of the day, customers and even “Brand Evangelisers” need to put their money where their mouth is
Hopefully, this strategy will help you avoid chasing attractive MacGuffins and enable you to focus on making your plot more interesting.

Very good article. I will be experiencing many of these issues as well.. Crystal Jason Othelia